The objective of this post is to study the effect on search behavior and user behavior for a number of websites and businesses based in Dubai as a result of the COVID-19 virus and the corresponding government sterilization program. The sterilization program started on March 15th and placed significant restrictions on people’s movements throughout the city. It’s important to highlight that although we studied over 20 websites across different sectors, the data we show below might not hold true for all websites within these sectors – some websites might be seeing very different search & user behavior than what we have found here.
Changes in User Behaviour
For this part of the study, we looked at a couple of websites that had a large number of visitors visiting the site, regardless of which channel the visitors used to reach the website (Search, Social Media, Emails, Paid Advertising, etc). The main criteria we used for this section was to include websites that:
- Had several hundred visitors per day.
- Had user activity throughout the 24-hour period of the day.
Only two websites fulfilled the above criteria.
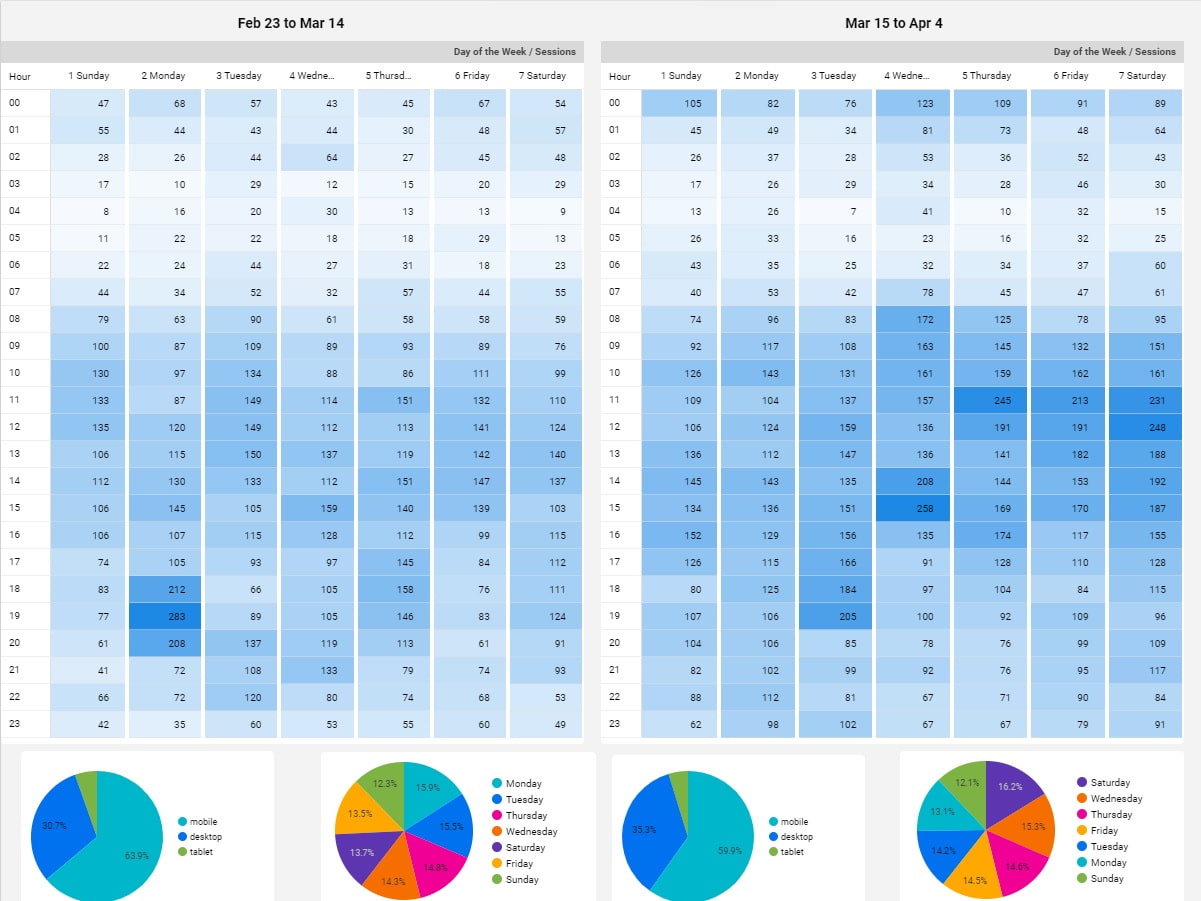
Please note the following with regards to the data within each of the below heat maps:
- Sunday is the first day of the working week in Dubai (the weekend is on Friday & Saturday).
- There are two heat maps in each image below. The one to the left is for the period between Feb. 23rd to Mar. 14th (before the government sterilization program began), and the one to the right is for the period between Mar. 15th to Apr. 4th (these are the same time frames for the first part of the study above).
- Both time frames start on a Sunday and end on a Saturday.
- The “Hour” column represents the hour of the day with 00 being midnight.
- Each day of the week is represented as a separate column and is an accumulation of all the sessions that took place on that day of the week for that period. (i.e. there are 3 Sundays in each time period, the data from all these Sundays are accumulated within its column). The same applies to the rest of the days of the week.
- The number shown in each cell represents the total number of sessions that took place during that hour for the cumulative 3 occurrences of that day of the week.
The first website:
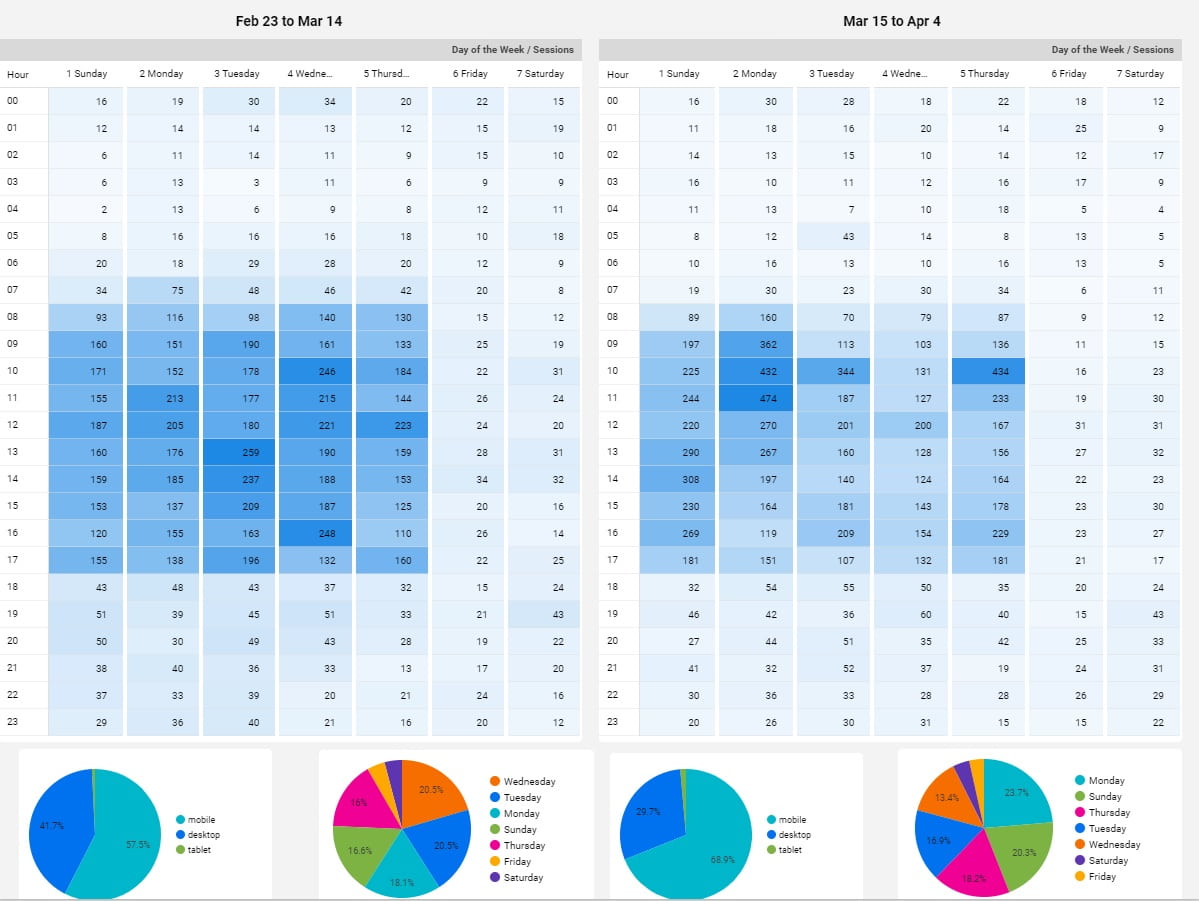
Changes in user behavior on the first website:
- A big shift towards browsing the website during the weekends after March 15th vs before. This can also be seen in the Pie Charts below the Heat Maps where Saturday and Sunday had the highest percentage of sessions during the government sterilization program vs. them having the lowest percentage of sessions before that.
- A shift towards browsing the website later in the evening and closer to the weekends after the government sterilization program vs. before.
- An increase in browsing the website during very early hours of the day (4:00 am, 5:00 am, 6:00 am) during the government sterilization program vs. before.
The second website:
Changes in user behavior on the second website:
- A big shift towards browsing the website over the weekend after the government sterilization program vs. before. This can also be seen in the Pie Charts below the heat maps where Friday and Saturday were the least popular days before the lockdown and then became the first and fourth most popular days after the lockdown.
- Desktop traffic saw a significant increase of (4.6%) after the lockdown vs. before.
- Similar to the first site, there’s a shift towards more browsing in the later hours of the night.
Changes In Search Behavior:
For this part, we aimed to look at the total number of searches the websites included in this study were appearing for during the period starting on Mar. 15th to Apr. 4th. We then compared the number of searches to the previous 3-week period between Feb. 23rd to Mar. 14th. We further broke down these searches based on the devices that people used to conduct the search.
The best way for us to translate these “Impressions” is to consider them a measure of “demand”. Whether these searches are for the brand name, or the products/services each website offers – it’s a good indicator of how much the “demand” changed when comparing these periods of time:
Advertising Services
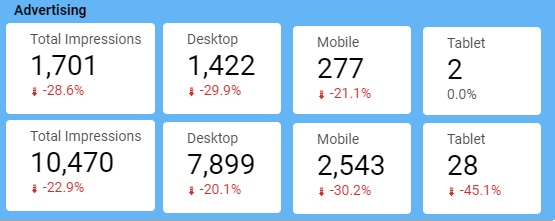
Both websites offering Advertising Services saw a significant drop in the number of searches they appeared for.
Business Services
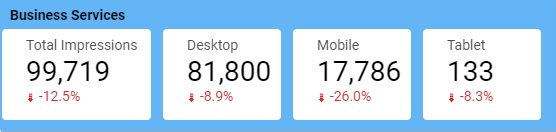
The Business Services website included in this study showed a considerable drop in the number of searches it appeared for.
Coaching Services
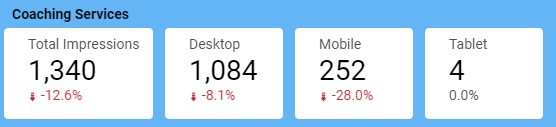
The Coaching Services website included in this study showed a considerable drop in the number of searches it appeared for.
Consumer (Non-Essentials)
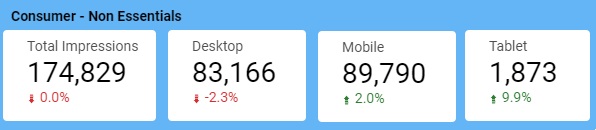
The Consumer (Non-Essentials) website we looked at was the only one that didn’t show any major losses or gains during the period covered in this study.
Entertainment Services
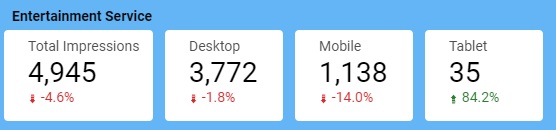
The Entertainment Website we looked at showed a small drop in the overall number of searches it appeared for – much more on the mobile side than on the desktop/laptop side.
Home Appliances
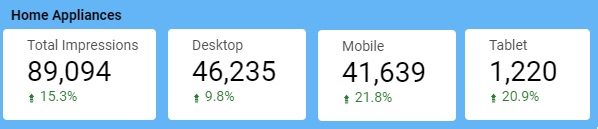
The Home Appliances website included in this study was one of the handful of websites that saw a significant increase in traffic during the period.
Home Services
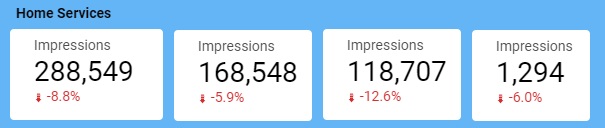
The Home Services website covered in this study showed a considerable drop in traffic during the period covered.
Insurance
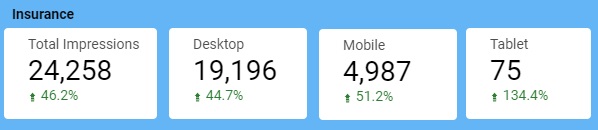
The Insurance website we saw was the biggest winner and witnessed the largest increase in search appearance of all the websites we looked at.
Marketing Services
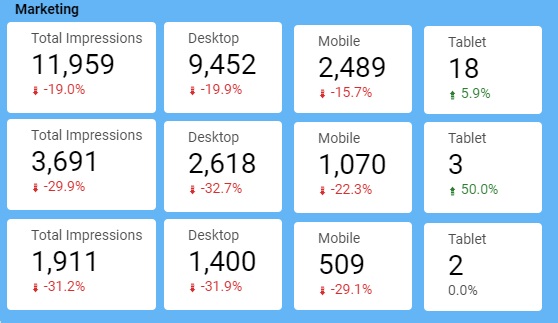
Three different websites within the Marketing sector were included in this study, and all three showed a significant drop in the number of searches they appeared for.
Medical (Non-Critical) Services
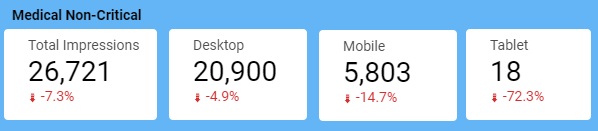
The website offering Medical (Non-Critical) Services included in this study showed a considerable drop in searches it appeared for during the period.
Mental Health Services
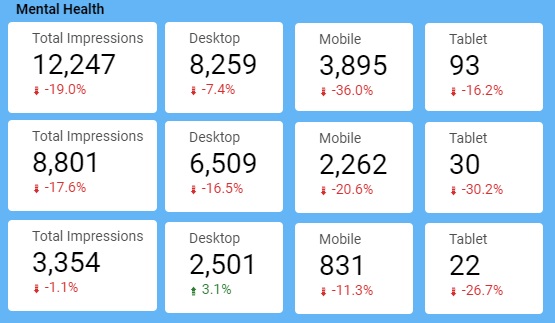
Only one website within this space had a small drop in the number of searches it appeared for, whereas the other two websites showed a significant drop for the period.
Retail (and Retail Related) Services
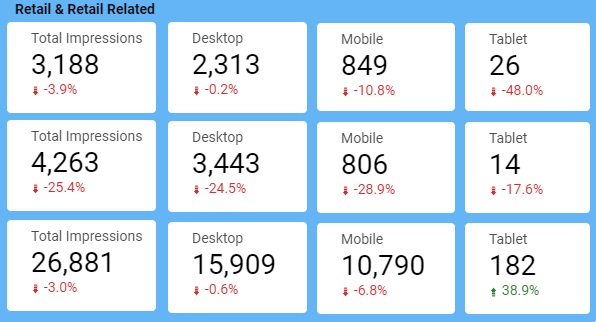
These websites are mainly retail-supporting services and are not restaurant websites. That being said, there was a significant drop in searches coming from mobile devices to these websites with one showing a much bigger drop in overall searches than the others.
Technology Services
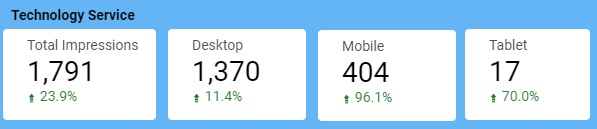
One of the few winners in this study, the website we looked at showed a significant increase in the number of searches it appeared for during the period.
Training Services
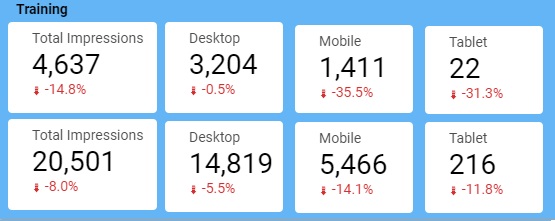
The two training related websites we looked at showed a considerable drop in the number of searches they appeared for while noting that the drop from searches conducted on mobile devices was much higher than those conducted on desktop/laptop devices.
Traffic Winners & Losers:
As you can see from the above, the websites from the following sectors have seen a drop in the number of searches they appear for:
- Advertising Services.
- Business Services.
- Coaching Services.
- Entertainment Services.
- Home Services.
- Marketing Services.
- Medical (Non-Critical) Services.
- Mental Health Services.
- Retail (and Retail Related) Services.
- Training Services.
The websites from the following sectors have seen an increase in the number of searches they appear for:
- Home Appliances.
- Insurance.
- Technology Services.
The Consumer (Non-Essentials) website we looked at had a very small variance in its traffic and remained within normal traffic fluctuations for the period.
It’s also worth noting that for most of the websites that witnessed a loss in the overall number of searches they appeared for, they saw a bigger drop in searches coming from mobile devices than those coming from desktop devices. This is also consistent with the previous section of our study with regard to changes in user behavior.
Additionally, the websites operating in the Advertising and Marketing sectors showed the biggest drops in searches they appeared for. It’s also interesting to point out that most of these websites witnessed a larger drop in desktop searches compared to mobile searches as opposed to all the other websites that saw a drop in their number of searches included in this study.
Conclusion:
Initially, we set out to look at changes in search behavior and user behavior on a number of Dubai-based websites as a result of the government’s sterilization program that began on March 15 and continued throughout the period mentioned above. The following observations were particularly noteworthy:
- The changes in the number of searches conducted across websites that operate in several sectors.
- The changes in how users conducted search and browsed websites – i.e. the overall drop in mobile usage.
- The shift towards more browsing over the weekend vs. weekdays.
- The shift towards browsing at earlier or later hours of the day.
We hope the above provides some insight for business owners and marketers in order to make more informed decisions about their marketing activities.
If you’re interested in an in-depth SEO Audit, E-Commerce SEO Audit, or Enterprise SEO services, please feel free to reach out to us.
Additional clarifications:
Data
The graphs used in this study are based on data from over 20 Dubai-based businesses extracted from their Google Search Console and Google Analytics accounts between the periods of March 15 (the date the UAE government announced its sterilization program) to April 4 compared to the periods between February 23 to March 14.
It’s worth noting that both periods start on a Sunday (the first day of the working week in the UAE) and end on a Saturday. This allows us to compare data from the exact number of days with time periods that start and end on the exact days of the week – keeping the timeframes consistent across the study.
Additionally, we ensured that all the websites involved in this study have not seen any loss in the search terms (keywords) they appear for during the time period covered within this study.
Clarifications on the terms used above:
Before proceeding with the findings, we’d like to clarify a few terms you’ll see below:
- Total Impressions: the number of times a website appears for a search in Google. Think of this as the overall “demand” for a website and its services/products. (Important note: we did not filter out any branded searches for any of the websites and kept the data as it is reported in Search Console. The reasoning behind this is to get an idea of the total searches for each website for both periods of time). This number is further broken down into 3 groups:
- Desktop (Impressions): The number of searches the website appeared for in Google conducted from a laptop or desktop.
- Mobile (Impressions): The number of searches the website appeared for in Google conducted from a mobile device.
- Tablet (Impressions): The number of searches the website appeared for in Google conducted from a tablet device.
- The percentages displayed under each number represent the change in the number of impressions (Total Impressions, Desktop Impressions, Mobile Impressions, and Tablet Impressions) when comparing the period of Mar 15th – Apr 8th with Feb 23rd to Mar 14th.
Disclaimer:
This is to confirm that we have permission from all the websites participating in this study to use their data anonymously. No website is specifically mentioned or highlighted. That being said, the information that we present in this blog post is collected from more than 20 Dubai-based websites.

Founder & CEO